My Heart Beats for U —— Heart Rate Sync Visualization in Grafana
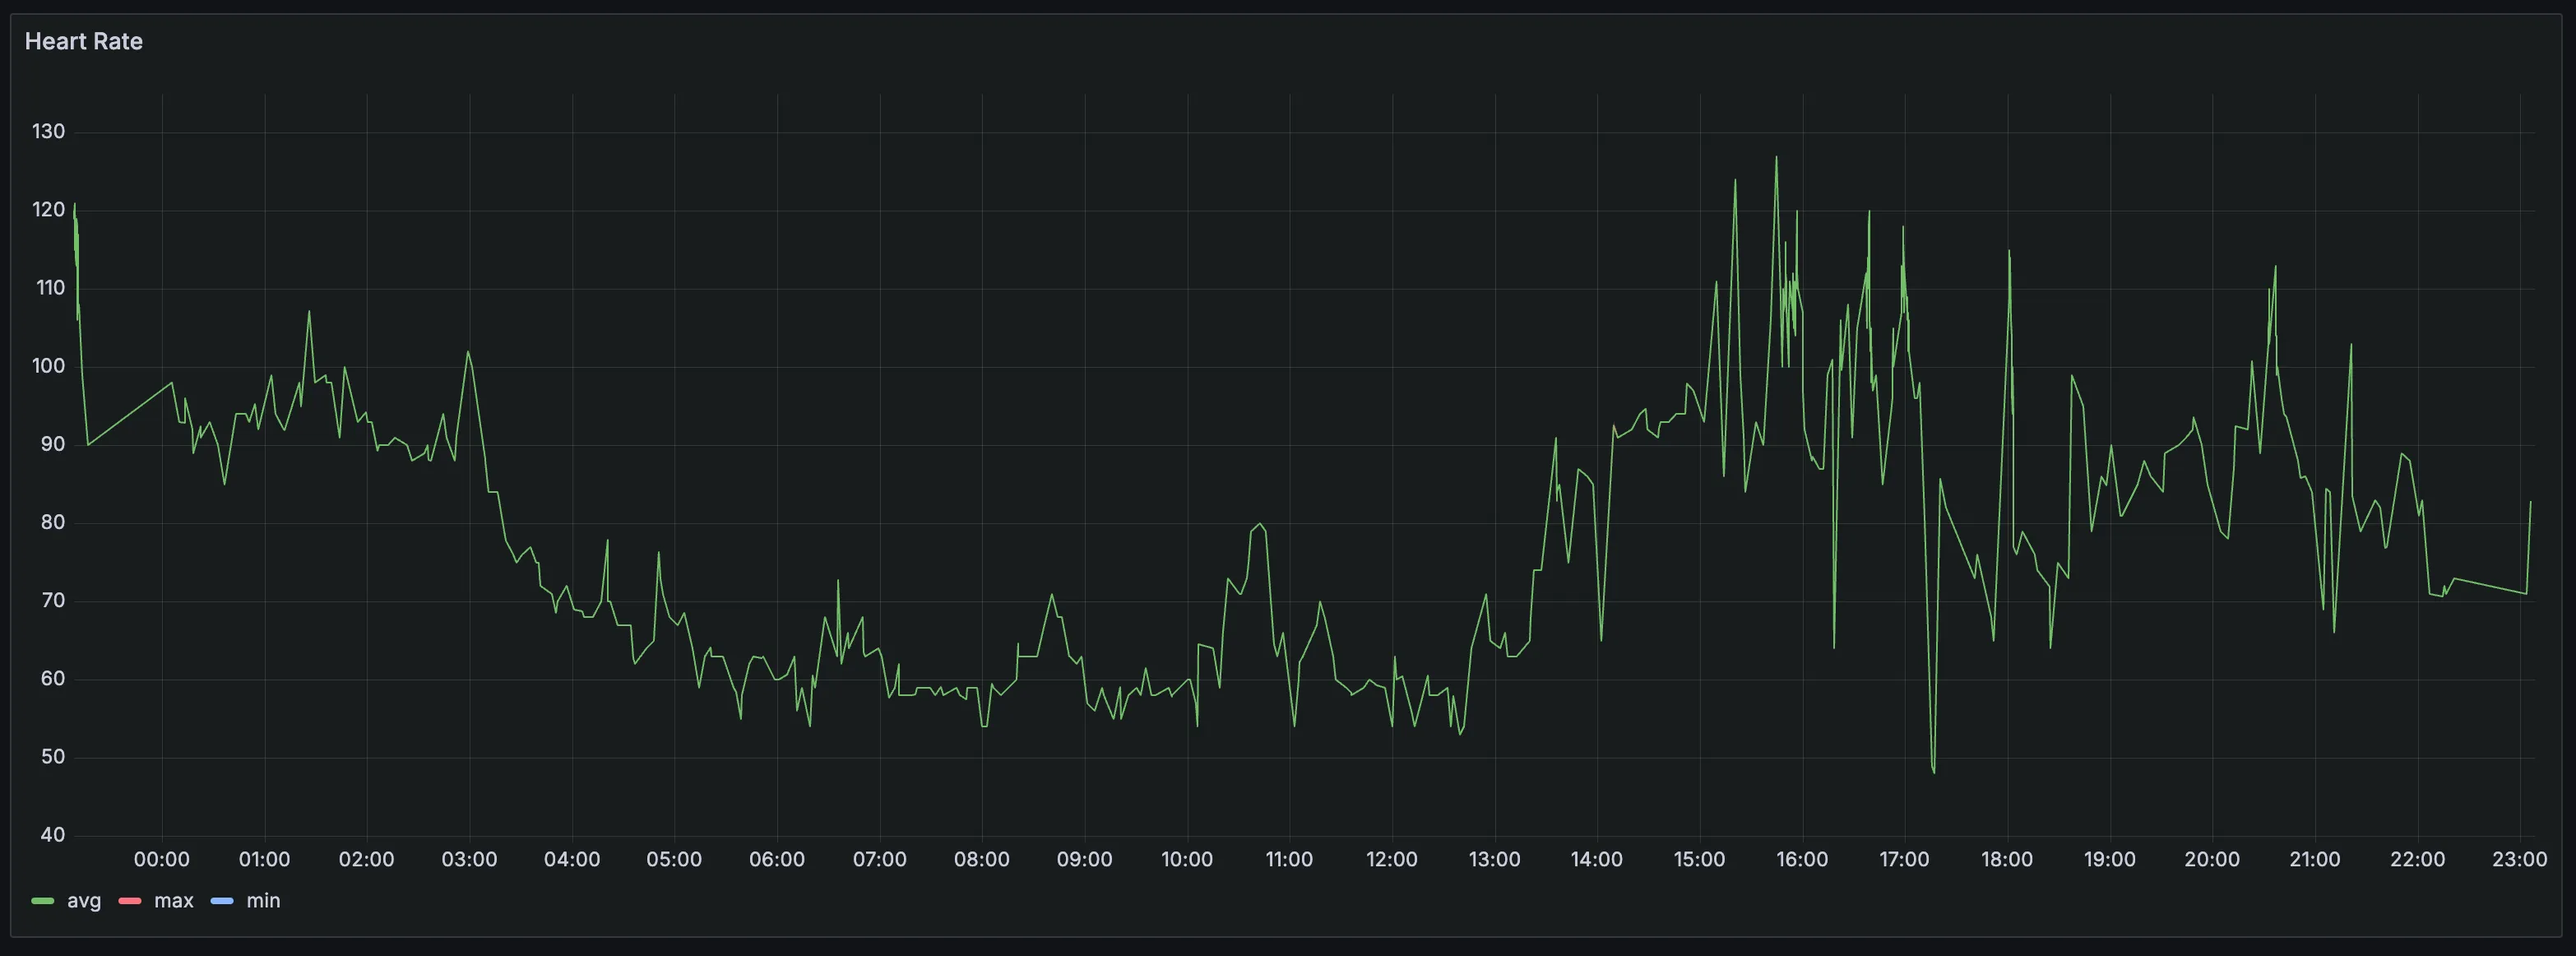
I worked on a little project: automatically syncing my Apple Health heart rate data to a server and displaying it with Grafana. Here’s how it looks:
You could click the ♥️ icon at the top right of the blog to see the demo, but since I set up a Cloudflare Tunnel, access in China is slow—use a VPN if needed. This is now offline, as I’ve switched to an Oppo phone and can no longer sync my heart rate.
The approach: I used the app Health Auto Export - JSON+CSV and its Restful API feature, scheduling regular uploads of heart rate data to my deployed HTTP endpoint. That endpoint writes the data into InfluxDB, which Grafana then connects to for dashboard visualization.
If you want scheduled sync with Health Auto Export - JSON+CSV, you’ll need to purchase a Premium license (Lifetime is $24.99 USD on the US App Store). It’s a bit pricey, but as far as I can tell, there isn’t a good alternative.
After subscribing, set up an Automation:
- Automation Type:
REST API - URL: The address of your service (the API path should be
/push/heart_rate) - Data Type:
Health Metrics - Select Health Metrics: Tick
Heart Rate - Export Format: JSON
- Sync Cadence: You can pick either 1 minute or 5 minutes. (Note: Apple Watch doesn’t monitor heart rate continuously.)
- Enable the automation. To ensure sync functionality even after the app quits, you can add a widget to your home screen.
Next, deploy your service with an open RESTful API endpoint to receive the data and write it to InfluxDB. I won’t go into details about deploying InfluxDB (just note, the service uses InfluxDB 2—Google for specific instructions).
The service source code is at reekystive/healthkit-collector. It’s a Node project—you can run it on port 3000 using pnpm. I wrote a Dockerfile to pack everything as a Docker image for easy deployment on my home server:
FROM node:20-alpine AS builder

# Install pnpm
RUN corepack enable && corepack prepare pnpm@9.14.2 --activate

# Set working directory
WORKDIR /app

# Copy package.json and pnpm-lock.yaml
COPY package.json pnpm-lock.yaml* ./

# Install dependencies
RUN pnpm install --frozen-lockfile

# Copy source code
COPY . .

# Build the application
RUN pnpm build

# Stage 2: Production stage
FROM node:20-alpine AS production

# Install pnpm
RUN corepack enable && corepack prepare pnpm@9.14.2 --activate

# Set working directory
WORKDIR /app

# Copy package.json and pnpm-lock.yaml
COPY package.json pnpm-lock.yaml* ./

# Install production dependencies only
RUN pnpm install --prod --frozen-lockfile

# Copy built application from builder stage
COPY --from=builder /app/dist ./dist

# Set environment variables
# These are default values that can be overridden when running the container
ENV NODE_ENV=production
ENV PORT=3000

# Expose the port your app runs on (using the PORT environment variable)
EXPOSE ${PORT}

# Command to run the application
CMD ["node", "dist/index.js"]
When launching the container, you need to set four environment variables for InfluxDB connectivity:
INFLUXDB_TOKEN='your_influxdb_token'
INFLUXDB_URL='your_influxdb_url'
INFLUXDB_ORG='your_influxdb_org'
INFLUXDB_BUCKET='your_influxdb_bucket'
Once deployed, try a manual sync—the service should log a successful database write.
Finally, deploy Grafana for dashboard visualization. After adding your InfluxDB data source and creating a new dashboard, you can use the following query:
from(bucket: "bpm")
  |> range(start: v.timeRangeStart, stop: v.timeRangeStop)
  |> filter(fn: (r) => r["_measurement"] == "heart_rate")
  |> filter(fn: (r) => r["_field"] == "avg" or r["_field"] == "max" or r["_field"] == "min")
Enjoy!